A green dashboard can mask a failing project when you track the wrong metrics. PMBOK® 8 teaches you to measure outcomes, not just outputs.
1. Why Is "Evaluate Status" a Critical Skill?
Imagine this: a mobile app development project. The team reports a stable velocity of 20 points/sprint. The burndown chart looks great. All metrics are green. Then, after go-live, customer support tickets spike 300%. Users complain that navigation is confusing. NPS drops from 45 to 15.
The problem? The team measured output (velocity, features completed) but not outcome (user satisfaction, usability). The dashboard is green, but the project is failing.
PMBOK® 8, Section 2.1.6.7: "Monitor and Control Project Performance is the process of tracking, reviewing, and reporting the overall project progress. The key benefits: stakeholders understand the current state, recognize actions taken, and gain visibility into the future project status."
Evaluate Project Status is not just "checking progress" — it is an early warning system that helps PMs detect problems before they become disasters.
2. Leading vs Lagging Indicators — Measuring What Matters
This is the most important distinction in measurement — and one many PMs overlook.
Leading Indicators | Lagging Indicators | |
|---|---|---|
Timing | Predicts the FUTURE — early warning | Measures the PAST — confirms outcomes |
Value | Enables PREVENTION | Enables ASSESSMENT |
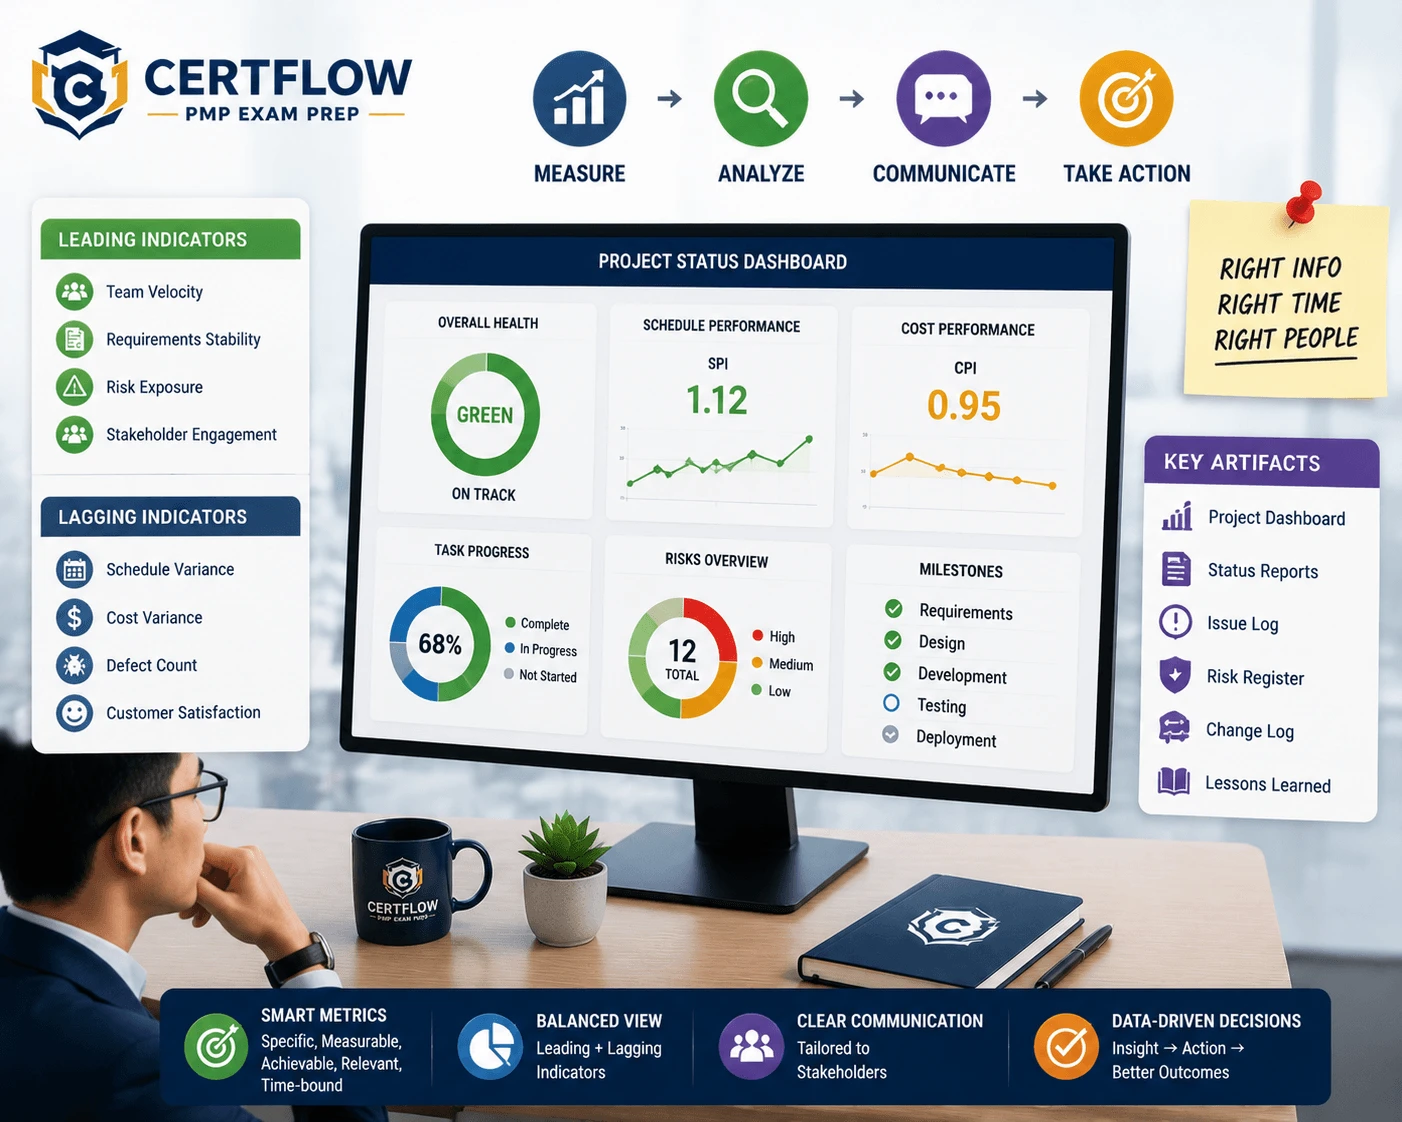
Examples | Declining stakeholder attendance, low team morale, rising defect trend, declining velocity | SPI, CPI, NPS, schedule variance, deliverables completed, customer complaints |
Action | Investigate and adjust BEFORE impact | Root cause analysis and corrective action AFTER impact |
PMBOK® 8: "Lagging indicators can also be used to find correlations between outcomes and environmental variables. For example, a schedule variance may show a correlation with project team member dissatisfaction." — Lagging indicators do not merely measure results; they can reveal hidden root causes.
A skilled PM tracks both — leading indicators for prevention, lagging indicators for confirmation and learning.
3. The 8-Enabler Framework for Status Evaluation
Group | Enabler | Core Question |
|---|---|---|
Design | Develop metrics, analysis, reconciliation | What to measure, and how to analyze it? |
Artifacts | Identify and tailor artifacts | What documents/artifacts does this project need? |
Artifacts | Ensure artifacts created, reviewed, updated | Are artifacts current and accurate? |
Artifacts | Ensure accessibility of artifacts | Can everyone who needs access get it? |
Assessment | Assess current progress | Where does the project stand against the plan? |
Analysis | Measure, analyze, update metrics | What does the data say? What action is needed? |
Communication | Communicate project status | Who needs to know what, when, and through which channel? |
Improvement | Assess effectiveness of artifact management | Is the tracking system working well? |
4. Develop Metrics — SMART Criteria and Avoiding Measurement Pitfalls
SMART Criteria for Metrics

PMBOK 8 (Section 2.1.5.3): "SMART criteria are guidelines used to set clear, attainable, and meaningful goals."
Criteria | Meaning | Good Example | Poor Example |
|---|---|---|---|
Specific | Clear and precise | "Reduce defect rate to below 3%" | "Improve quality" |
Measurable | Quantifiable with numbers | "CPI ≥ 0.95" | "Budget on track" |
Achievable | Realistic and attainable | "Velocity 20±3 points/sprint" | "Zero defects" |
Realistic | Relevant to project objectives | "NPS ≥ 40 post-launch" | "Lines of code written" |
Time-bound | Has a defined deadline | "Achieve by Sprint 8" | "Eventually" |
Measurement Pitfalls — PMBOK 8 Warnings
PMBOK® 8, Section 2.1.6.7.1: "Hawthorne effect — the very act of measuring something influences behavior. Measuring only output of deliverables can encourage the team to focus on creating a large volume rather than deliverables that provide higher customer satisfaction."
Common measurement pitfalls:
Pitfall | Description | How to Avoid |
|---|---|---|
Hawthorne Effect | Measuring something → team focuses on it and neglects everything else | Measure a balanced set: output + outcome + process |
Vanity Metrics | Metrics that look impressive but are meaningless (e.g., total features built) | Focus on actionable metrics (e.g., adoption rate) |
Gaming | Team optimizes for the metric, not for value (e.g., inflating story points) | Use multiple complementary metrics, audit periodically |
Over-measurement | Measuring too much → high overhead, data overload | "Measure only what is relevant and ensure metrics are actionable" (PMBOK 8) |
5. Artifacts — Identify, Create, and Manage
PMBOK 8 defines: "An artifact is a document or other item created during a project to help manage it and provide information."
Identify and Tailor Artifacts
Not every project needs the same artifacts. PMs must tailor — selecting artifacts suited to the project's complexity, development approach, and organizational needs.
Predictive Artifacts | Adaptive Artifacts | Both |
|---|---|---|
Project management plan | Product backlog | Risk register |
WBS + WBS Dictionary | Sprint backlog | Issue log |
Scope statement | Definition of Done | Change log |
Schedule baseline | Burndown / Burnup charts | Lessons learned register |
Cost baseline | Velocity charts | Stakeholder register |
Requirements traceability matrix | Task board / Kanban board | Communication plan |
Ensure Artifacts Are Living Documents
PMBOK 8 emphasizes that artifacts must be "living documents" — continuously reviewed, updated, and documented. An outdated artifact = wrong data = wrong decisions. PMs must establish a cadence: who reviews, how often, and who approves updates.
Ensure Accessibility
Artifacts must be accessible to the right people — PMBOK 8: "Cloud computing has revolutionized data storage and access, ensuring that all team members have uniform access to essential project information." However, security also matters: not every artifact should be visible to everyone (financial data, HR information, sensitive risks).
6. Assess Progress and Analyze Metrics
Assess Current Progress
PMBOK 8 Monitor and Control Project Performance includes: evaluating performance compared to plan, tracking utilization of resources/work/budget, demonstrating accountability, providing information to stakeholders, assessing whether deliverables are on track to deliver benefits, making fact-based decisions, and analyzing root causes of variances.
Work Performance Data → Information → Reports
Level | Description | Example |
|---|---|---|
Work Performance Data | Raw observations and measurements — not yet analyzed | Task A: 75% complete, $12K spent, 3 defects found |
Work Performance Information | Analyzed data — compared against baselines | CPI = 0.88, SPI = 1.05, defect rate trending up |
Work Performance Reports | Information synthesized into reports for stakeholders | Dashboard RAG, earned value report, risk summary |
Key Analysis Tools
PMBOK 8 lists: Variance Analysis (actual vs plan), Trend Analysis (pattern over time), Earned Value Analysis (CPI, SPI, EAC), Root Cause Analysis (5 Whys, Fishbone), What-If Analysis (scenario planning), and AI/Predictive Analytics (pattern discovery, future prediction).
PMBOK® 8: "AI and ML can offer predictive insights based on historical data, helping to effectively allocate resources, identify potential risks, report on project progress using leading and lagging indicators, and optimize project trajectories."
7. Communicate Project Status — The Right People, the Right Format
Audience-Specific Reporting
Audience | What They Need | Format | Frequency |
|---|---|---|---|
Sponsor / C-suite | Overall health, key risks, decisions needed | 1-page dashboard, RAG status | Bi-weekly / monthly |
Steering committee | Strategic alignment, ROI tracking, escalations | Presentation + executive summary | Monthly / quarterly |
Project team | Task details, blockers, sprint progress | Boards, standups, burndown | Daily / sprint-level |
PMO | Portfolio rollup, resource utilization, standards | Standardized templates | Per org cadence |
External clients | Deliverable status, timeline, quality | Per contract/SLA format | Per agreement |
Project Dashboards — PMBOK 8
PMBOK 8: "A set of charts and graphs showing progress or performance against important measures, often including RAG charts, bar charts, pie charts, and control charts." Dashboards must be VISUAL — sponsors don't want to read 20 pages of text.
Information Radiators
PMBOK 8: "A visible, physical display that provides information to the rest of the organization. Low tech and high touch." Kanban boards and burndown charts posted in the workspace let everyone see status without scheduling a meeting.
8. Predictive vs Adaptive Status Tracking
Aspect | Predictive | Adaptive |
|---|---|---|
Primary metrics | EVM (CPI, SPI, EAC), milestone completion %, scope completion | Velocity, burndown/burnup, cycle time, WIP, throughput |
Baseline | Formal PMB (scope + schedule + cost) | Iteration baseline, release plan |
Key artifacts | PM plan, Gantt chart, status reports, EVM reports | Backlog, task board, burndown/burnup, DoD checklist |
Review cadence | Phase gates, milestone reviews, monthly reports | Sprint reviews, daily standups, retrospectives |
Variance detection | Formal variance analysis against baselines | Velocity trends, sprint goal completion rate |
Status communication | Formal reports, dashboards, presentations | Information radiators, demos, transparency tools |
9. PMP Exam Tips
📍 Tip 1: Data → Information → Reports: Raw data (task 75% done) → Analyzed information (SPI = 0.85) → Reports (dashboard for the sponsor). Exam questions frequently test "what is work performance data?" vs "work performance information" — data = raw, information = analyzed, reports = formatted for audience.
📍 Tip 2: Leading > Lagging for early warning: When a question describes a stakeholder "going quiet" or "team morale declining" — that is a LEADING indicator. The PM must investigate, NOT wait for a formal complaint (a lagging indicator).
📍 Tip 3: Tailor artifacts: Not every project needs every artifact. When a question asks "what does an agile project need for documentation?" — the answer is usually "tailor to what's needed," NOT "follow the organizational template regardless" or "no documentation in agile."
📍 Tip 4: Hawthorne Effect: When a question describes "team focuses only on velocity, ignoring quality" — that is the Hawthorne Effect (measuring something influences behavior). The correct answer: balance metrics — measure velocity AND defect rate AND customer satisfaction.
10. Ten Scenario-Based Practice Questions
Question 1
Your team's velocity has been stable at 25 points/sprint for 6 sprints. All sprint goals are met. However, customer support tickets have increased 200% since the last release.
What does this reveal about your metrics?
A. Velocity is a good metric — the issue is with customer support.
B. The team is measuring OUTPUT (velocity, sprint goals) but not OUTCOME (customer satisfaction, usability). Add outcome metrics like NPS, support ticket volume, and user adoption rate.
C. Sprint goals should include customer satisfaction criteria.
D. The customer support team needs training.
Question 2
The sponsor asks: "Give me the project status in one page." Currently, your team produces a 15-page weekly report with detailed EVM tables, risk logs, and resource utilization charts.
What should you do?
A. Create a 1-page executive summary and attach the 15-page report as appendix.
B. Create a project dashboard with RAG status, key metrics, top risks, and decisions needed — tailored specifically to what the sponsor needs to know and decide.
C. Ask the sponsor to read at least the executive summary of the full report.
D. Reduce the report to 1 page by cutting all but the most critical metrics.
Question 3
Your project uses a predictive approach. During the monthly status review, you discover: CPI = 0.88, SPI = 1.05, and the risk register hasn't been updated in 6 weeks.
What are your two biggest concerns?
A. CPI is low and SPI is high — the project is over budget but ahead of schedule. Both are acceptable trade-offs.
B. CPI below 1.0 means cost overrun — investigate root cause. And the stale risk register means potential risks are not being monitored — an outdated artifact = blind spots.
C. Focus on the CPI only — schedule is fine.
D. The risk register is a low-priority artifact — focus on EVM metrics.
Question 4
A new team member asks: "Where is the current version of the project schedule? I found three different versions on the shared drive, Jira, and an email attachment."
What artifact management problem does this reveal?
A. The team needs training on file management.
B. Artifact accessibility and version control are broken. There should be a single source of truth with clear ownership, version control, and access policies — multiple versions create confusion and risk decisions based on outdated information.
C. Too many tools — consolidate to one platform.
D. This is normal for large projects — the new member will learn which version to use.
Question 5
Your agile team's burndown chart shows work remaining is decreasing steadily. However, the number of items in "In Progress" on the Kanban board has been increasing for 3 sprints — from 5 to 12 to 18 items simultaneously.
What does the rising WIP indicate?
A. The team is working on more items simultaneously — they're being more productive.
B. Rising WIP is a LEADING INDICATOR of future delivery problems. Too many items in progress means nothing is getting finished — the burndown looks good because work started, but completion will stall. The team should reduce WIP limits.
C. The Kanban board needs better categorization.
D. The team size has increased — more people means more WIP.
Question 6
The PMO requires all projects to use a standardized 20-field status report template. Your agile project is small (5 people, 3-month duration) and 15 of the 20 fields are irrelevant (no earned value, no formal procurement, no sub-projects).
What should you do?
A. Fill in all 20 fields as required — organizational standards must be followed.
B. Request a waiver from the PMO since your project is too small for the template.
C. Discuss with the PMO to tailor the template — keeping the fields relevant to your project and replacing irrelevant ones with agile-appropriate metrics like velocity and burndown.
D. Use the template for PMO reporting but track your project using agile artifacts internally.
Question 7
Your project dashboard shows green status (all metrics within thresholds). A team member privately tells you: "Nobody trusts these numbers. We mark tasks as done to keep the dashboard green, but we know there are quality issues we haven't addressed."
What is the ROOT CAUSE?
A. The team needs ethics training about honest reporting.
B. The metrics and incentive structure are causing gaming behavior — the team is optimizing for the metric (green dashboard) rather than the goal (quality deliverables). Revise metrics to include quality indicators, create psychological safety for honest reporting, and separate status tracking from performance evaluation.
C. Add more quality metrics to the dashboard.
D. The PM should verify all task completions personally.
Question 8
At a steering committee meeting, you present project status. A committee member challenges: "Your report says on-track, but the vendor told me they're 3 weeks behind on the API delivery."
What went wrong?
A. The vendor should communicate through proper channels, not directly to committee members.
B. Your status assessment didn't capture external dependencies accurately. The artifact (status report) was incomplete — missing vendor progress data. Investigate immediately, update your assessment, and establish regular vendor status integration.
C. Committee members shouldn't contact vendors directly.
D. The vendor is managing expectations differently with different stakeholders.
Question 9
Your organization doesn't have a formal project management methodology. You're starting a new project and need to determine which artifacts to create.
What is the BEST approach?
A. Create all artifacts from PMBOK 8 to ensure completeness.
B. Create no artifacts — focus on delivering value.
C. Assess project complexity, stakeholder needs, regulatory requirements, and development approach — then select the minimum set of artifacts that provides sufficient control, communication, and governance for THIS specific project.
D. Copy the artifact set from the most recent successful project.
Question 10
Your project's lessons learned register hasn't been updated since month 2. It's now month 8 of a 12-month project. The PM says: "We'll capture everything at the end."
What is wrong with this approach?
A. Nothing — lessons learned are typically captured at project closure.
B. Lessons learned should be captured CONTINUOUSLY — not just at the end. By month 8, valuable insights from months 3-8 are likely forgotten. The ECO requires "ensure artifacts are created, reviewed, updated, and documented" throughout the project.
C. Assign someone to update the register monthly.
D. Schedule a mid-project lessons learned session.
11. Answer Key
Question 1:
Answer: B — PMBOK 8: "Measuring only output of deliverables can encourage focus on large volume rather than higher customer satisfaction." Velocity is a valuable output metric but incomplete alone. The PM must add outcome metrics to get the full picture.
Question 2:
Answer: B — PMBOK 8: "Project information should be adapted to provide information at an appropriate level, format, and detail for each type of stakeholder." A dashboard designed for the sponsor's decision-making needs is different from an appendix of the old report (A) or a cut-down version (D).
Question 3:
Answer: B — CPI 0.88 means for every $1 spent, only $0.88 of value. This needs investigation. AND a 6-week-old risk register = artifacts not "reviewed and updated" as ECO requires. New risks may have emerged. Stale artifacts = false sense of security.
Question 4:
Answer: B — The ECO requires "ensure accessibility of artifacts" and "ensure artifacts are created, reviewed, updated, and documented." Three versions = no single source of truth = risk of decisions based on wrong data. The PM must establish version control, access policies, and a clear "current version" location.
Question 5:
Answer: B — Rising WIP is a classic leading indicator. Burndown shows started work but doesn't distinguish "started" from "nearly finished." High WIP = context switching, multitasking, and diminishing throughput. PMBOK 8 mentions Kanban method focuses on "limiting work in process (WIP)."
Question 6:
Answer: C — PMBOK 8 Tailoring: "project management activities should be adjusted to fit the characteristics and environment of a given project." The ECO requires "identify and tailor needed artifacts." Tailor in collaboration with the PMO — not ignore (B) or blindly follow (A). D creates dual tracking overhead.
Question 7:
Answer: B — PMBOK 8 Hawthorne Effect: "the very act of measuring something influences behavior." When metrics incentivize "green" over "accurate," gaming occurs. The fix is systemic — revise what's measured, how it's used, and create safety for honest reporting. Just adding metrics (C) without fixing incentives = more gaming.
Question 8:
Answer: B — The ECO requires "assess current progress" comprehensively — including external dependencies. If the PM's status report missed a 3-week vendor delay, the artifacts and data collection process have gaps. PMBOK 8: "evaluate performance compared to plan" includes ALL work, internal and external.
Question 9:
Answer: C — PMBOK 8: "project management activities should be adjusted to fit the characteristics and environment of a given project." The ECO requires "identify and tailor needed artifacts." All artifacts (A) creates bureaucracy. No artifacts (B) loses control. Copying (D) ignores different context. Tailoring = right-sizing for the project.
Question 10:
Answer: B — PMBOK 8: "Lessons learned are incorporated during the ongoing processes, not only at the end of the project." Waiting until month 12 = losing 10 months of insights. The register is an artifact that must be a living document. D is a partial fix; B is the systemic answer.
12. Conclusion
Evaluate Project Status is the "nervous system" of a project — collecting signals, analyzing them, and communicating them to the right people so the right decisions get made.
Three takeaways:
1. Measure the right things > Measure more things — Output metrics (velocity, milestones) are necessary but not sufficient. Outcome metrics (satisfaction, adoption, value) reveal the true picture. Leading indicators warn early; lagging indicators confirm. Balanced measurement = balanced view.
2. Artifacts must live, not gather dust — A risk register six weeks out of date = blind spots. Three versions of a schedule = confusion. Lessons learned written only at project end = losing 80% of insights. Artifacts are living documents — reviewed, updated, accessible, with a single source of truth.
3. Tailor reporting to the audience, don't broadcast — Sponsors need a 1-page dashboard. Teams need daily standups. PMOs need standardized templates. Regulators need formal evidence. One-size-fits-all reporting = nobody reads it. PMBOK 8: "adapted to provide information at an appropriate level, format, and detail."
PMBOK® 8, Section 2.1.6.7: "Measurement requires time and effort that could be allocated to other productive tasks; therefore, project teams should focus on measuring only what is relevant and ensure that the metrics are actionable."
Frequently Asked Questions (FAQ)
What are leading and lagging indicators in project management?
Lagging indicators measure outcomes that have already occurred — schedule variance, cost variance, defect count. This information arrives late; the PM only learns about problems after they have happened. Leading indicators measure early signals — velocity trends, risks identified, stakeholder engagement score. PMs need both: leading indicators for prevention, lagging indicators for confirmation.
What criteria must SMART metrics meet in project management?
SMART = Specific (clear, not vague), Measurable (quantifiable with numbers), Achievable (realistic and attainable), Relevant (connected to project objectives), and Time-bound (with a concrete timeline). A good example: "Reduce defect rate from 5% to 2% by end of Sprint 6." A poor example: "Improve quality" — not measurable, not time-bound.
What types of project artifacts does PMBOK 8 define?
PMBOK 8 categorizes artifacts as: Strategy artifacts (project charter, business case), Logs & Registers (risk register, issue log, change log), Plans (project management plan, subsidiary plans), Hierarchy charts (WBS, OBS, RBS), Baselines (scope, schedule, cost), and Visual data (dashboards, burndown charts). Artifacts are the "evidence" of PM work.
Now that you understand project status evaluation — it's time to practice with real exam questions.
Next article: Professional Project Closure per PMBOK 8
Try Free PMP Practice Questions →
Official References: