Toyota or Rolls Royce — which has higher quality? The answer reframes everything: QA vs QC, Cost of Quality, and 7 quality tools you need for the PMP 2026 exam.
Toyota or Rolls Royce — which one has higher quality? If you answered Rolls Royce, you are confusing "quality" with "luxury." According to PMI, both can have high quality — because quality is the degree to which requirements are met, not price or premium features.
Understanding quality correctly is the first step to managing it. And this is one of the knowledge areas that many PMP candidates underestimate — only to be caught off guard by questions about Control Charts, the Rule of Seven, or Cost of Quality in the exam room.
This article walks through the complete project quality management process — from foundational concepts, planning, quality assurance, and quality control, to the 7 basic quality tools.
What Is Quality? — Not What You Think
According to ISO 9000, quality is "the degree to which a set of inherent characteristics fulfills requirements." Simply put: does the product do what stakeholders asked for?
Quality vs Grade — Know the Difference
- Quality: The degree to which requirements are met — high quality = requirements well met, low quality = requirements not met
- Grade: A category based on technical features — Toyota has a lower grade than Rolls Royce, but both can have high quality
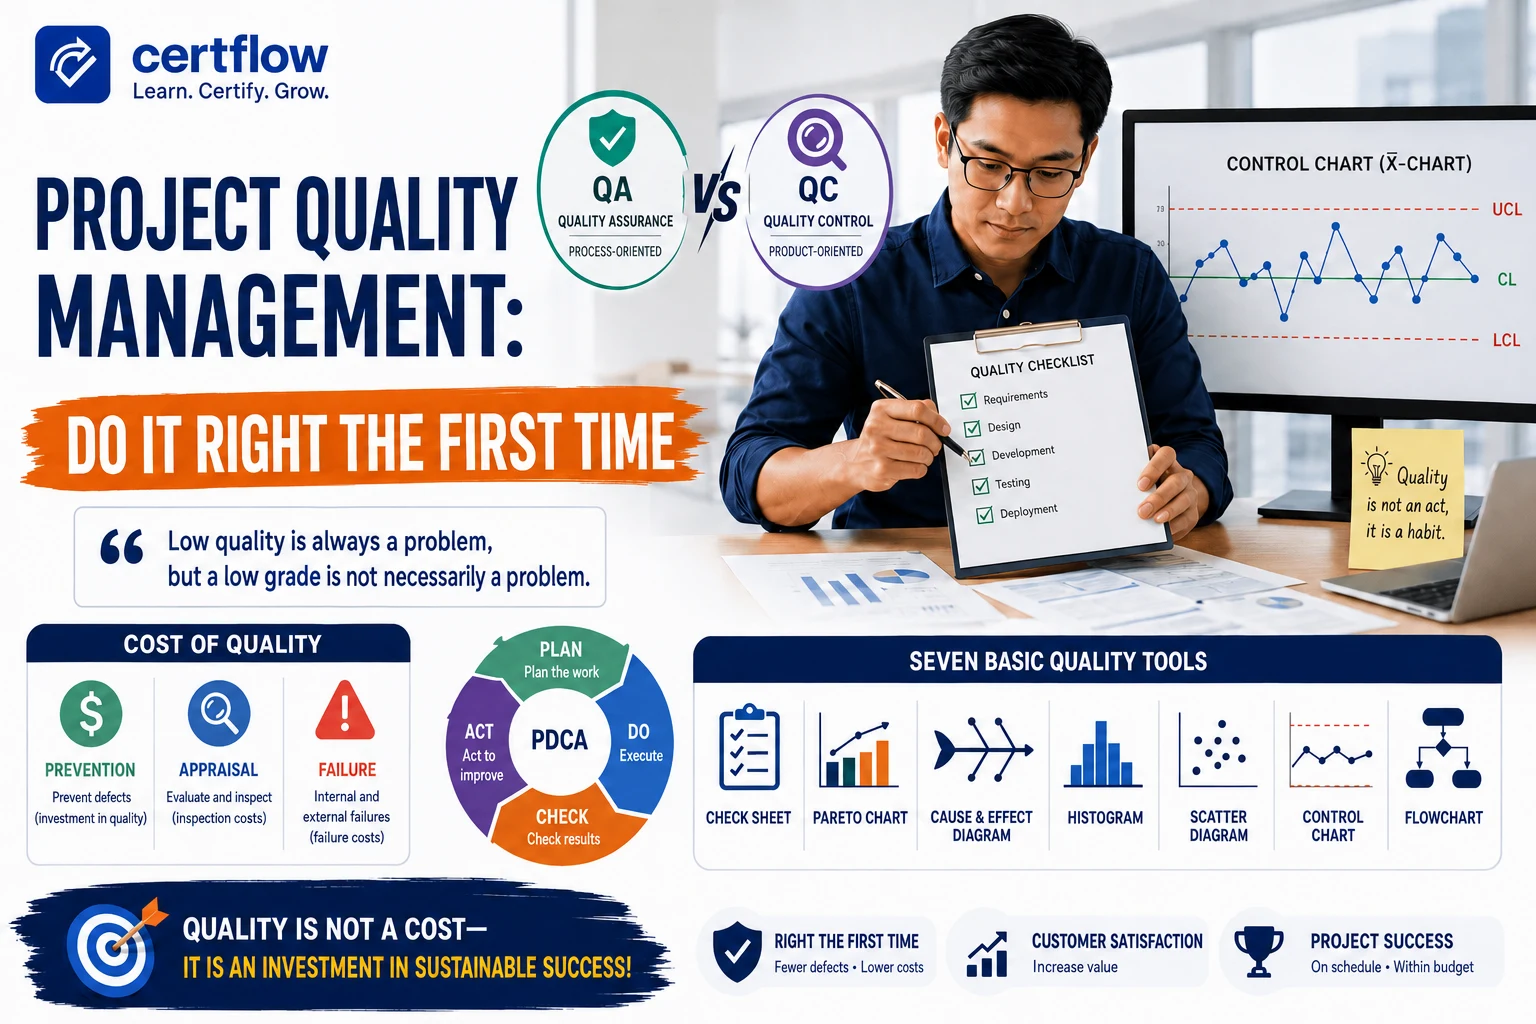
Low quality is always a problem. Low grade may not be. A Toyota that runs reliably and meets customer needs = high quality, low grade. A Rolls Royce that breaks down frequently and fails to meet expectations = low quality, high grade.
Accuracy vs Precision
- Accuracy: Measured values are very close to the true value
- Precision: Repeated measurements are very close to each other, with low scatter
You can be precise without being accurate (shots miss but consistently land on the same side). Or accurate without being precise (the average hits the target but scatter is wide). Ideally, you want both.
Quality Metrics
Quality metrics specifically describe how an attribute of a product or project will be measured. Examples: defect rate, bug rate, failure rate, test pass rate. Metrics must be in measurable form — not "good quality" but "defect rate < 2%."
QA vs QC — Two Sides of Quality
Many PMs use QA and QC interchangeably — but they are two distinct processes in PMBOK:
QA — Quality Assurance | QC — Quality Control | |
Goal | Ensure the process is right | Verify the product is right |
Timing | Throughout the project (proactive) | When the product is created (reactive) |
Example | Quality audits, process reviews | Inspection, testing, sampling |
PMBOK Process | Manage Quality | Control Quality |
📍 PMP Exam Tip: When a question asks "What should the PM do to prevent defects?" → QA (Manage Quality). When it asks "What should the PM do after discovering the product does not meet standards?" → QC (Control Quality).
Plan Quality Management
Identify quality requirements and standards for the project, and determine how to demonstrate compliance.
Cost of Quality (COQ)
COQ was mentioned in Cost Management, but it belongs to Quality Management. A quick recap:
- Cost of Conformance: Money spent DURING the project to AVOID failures
+ Prevention costs: training, documentation, equipment, time to do it right
+ Appraisal costs: testing, inspection, destructive testing
- Cost of Non-conformance: Money spent DURING and AFTER the project BECAUSE of failures
+ Internal failure: rework, scrap
+ External failure: liabilities, warranty, lost business
External failure is the most expensive type — because by then the product has already reached the customer. Investing in prevention is always cheaper than addressing failures.
Marginal Analysis
Find the point where the benefit or revenue from improving quality equals the additional cost. Follows the Law of Diminishing Returns — beyond a certain threshold, spending more on quality does not deliver proportional additional value.
Quality Management Plan
A component of the project management plan that describes how the organization will implement its quality policy. Includes:
- Quality objectives and standards
- Roles & responsibilities for quality
- Deliverables and processes subject to quality review
- QA activities and QC activities
- Quality tools to be used
Manage Quality — Ensuring the Right Processes
Execute the quality activities defined in the plan — ensure the team follows the processes and that those processes are effective.
Quality Checklists
Structured tools used to verify that a set of required steps has been performed. Can be simple (Yes/No) or complex (imperatives "do this" or interrogatories "have you done this?").
Example: "Did you enable maintenance mode before deploying? ☑️
Did you create a source code tag? ☑️
Did you clear the cache? ☑️"
Checklists should include acceptance criteria from the scope baseline — connecting quality with scope.
Quality Audits
Structured, independent reviews to determine whether project activities comply with policies, processes, and procedures. Can be scheduled or random, internal or external. Audit results help reduce Cost of Quality and increase the likelihood of customer acceptance.
Quality Improvement Methods
- PDCA (Plan-Do-Check-Act): Deming's continuous improvement cycle — plan → do → check → act → repeat
- Six Sigma: A methodology to reduce defects to 3.4 defects per million opportunities
- Lean Manufacturing: Eliminate waste — originated at Toyota
+ Just-In-Time (JIT): Reduce inventory to near zero
+ Kaizen: Continuous improvement — "improve people first, then products"
Other Tools
- Process Analysis: Identify non-value-added activities — uses Value Stream Mapping
- Design for X (DfX): Technical guidelines to optimize specific aspects: reliability, usability, manufacturing, cost, safety...
Control Quality — Inspecting the Product
Determine whether project outputs meet their intended purpose — whether they comply with standards, requirements, and regulations.
Inspection vs Testing
Inspection | Testing |
Visual examination, measurement, comparison against standards | Run the product to find errors, defects, bugs |
Can occur at any level (activity or final product) | Type and extent of testing depends on the project, time, and budget |
Also known as: reviews, peer reviews, audits, walkthroughs | Early testing significantly reduces the cost of fixing defects |
Statistical Sampling
Selecting a portion of a population for inspection rather than inspecting everything. Sample frequency and size are determined in the Plan Quality process.
Statistical Concepts to Know
- Statistical Independence: The outcome of one process is unrelated to another
- Mutually Exclusive Events: Choosing one option excludes the other (e.g., flipping a coin)
- Standard Deviation: Measures the spread of data
- Six Sigma: 99.99966% accuracy = 3.4 defects per million
Key Outputs
- Quality Control Measurements: Results of inspection — number of defects, test pass/fail
- Verified Deliverables: Deliverables checked by QC → become input to Validate Scope
🗒️ Reminder: Control Quality (internal, verified) → Validate Scope (external, accepted). QC checks that the product meets specifications. Validate Scope seeks formal acceptance from the customer. These are two distinct steps — neither replaces the other.
7 Basic Quality Tools — Know Them All
The seven basic quality tools are mandatory knowledge for PMP. Each tool serves a specific purpose:
1. Flowchart
A graphical representation of the steps in a process and their relationships. Helps understand the process, estimate Cost of Quality, and identify where defects may occur or where quality checks are needed.
2. Control Chart
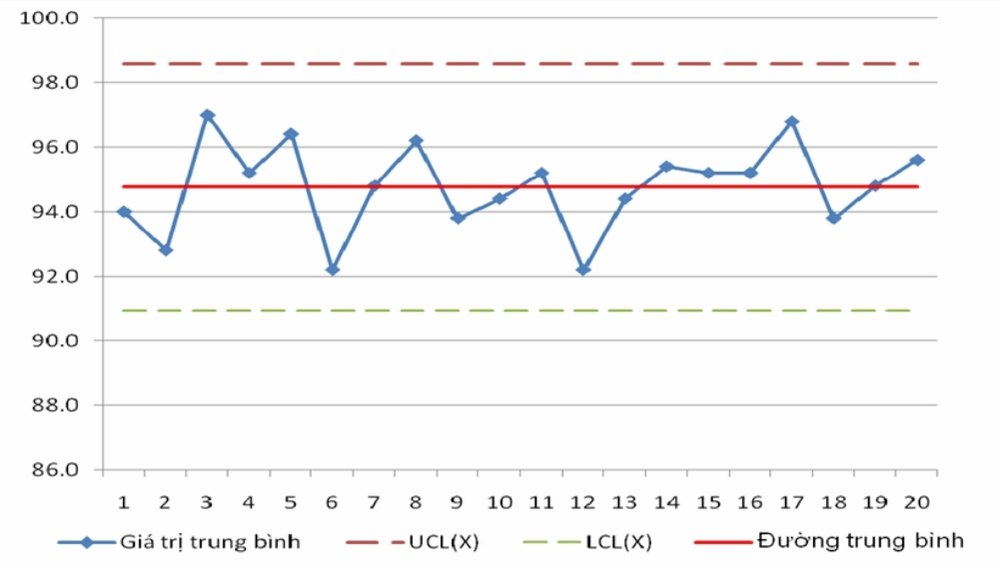
Determines whether a process is in control or out of control — whether the process is stable and predictable.
- Upper/Lower Control Limits: Control limits — data within the limits = in control
- Specification Limits: Limits set by the contract or customer — may be tighter than control limits
- Mean: The average value
- Out of Control: When a data point falls OUTSIDE control limits OR violates the Rule of Seven
- Rule of Seven: 7 consecutive data points on the SAME side of the mean → out of control, even if still within control limits
- Assignable Cause / Special Cause Variation: A data point that requires investigation
📍Exam tip: Control Charts appear frequently on the PMP exam. Remember the Rule of Seven — 7 consecutive points on the same side of the mean = OUT OF CONTROL even if still within limits. Also distinguish: control limits (from the process) vs specification limits (from the customer/contract).
3. Checksheet
Collects real-time data at the point where data is generated. Data can be quantitative (tally sheet) or qualitative. Simple yet effective.
4. Histogram

Displays data as bars showing the frequency distribution. Helps identify which problems are worth addressing. Data is not arranged in any specific order.
5. Pareto Chart (80/20)
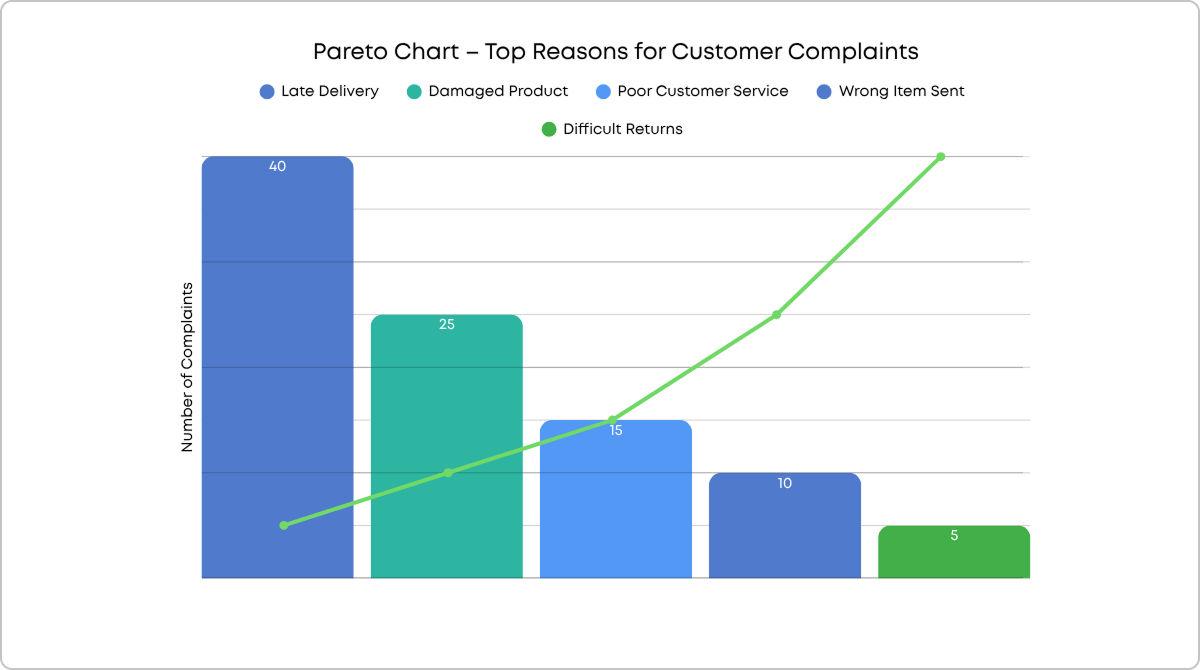
Based on the 80/20 principle: 80% of problems are caused by 20% of root causes. A Pareto chart ranks causes from highest to lowest frequency, helping you focus on the "critical few" rather than the "trivial many." Address the tallest bar first — that is where the greatest impact lies.
6. Cause-and-Effect Diagram (Fishbone / Ishikawa)

Analyzes the root causes of a problem. Resembles a fish skeleton with the "head" being the problem and the "bones" representing cause categories (typically the 6Ms: Man, Machine, Method, Material, Measurement, Mother Nature). Stimulates thinking, organizes ideas, and drives discussion.
7. Scatter Diagram

Shows the relationship between two variables. Dependent variable vs independent variable. The closer the points are to the diagonal line, the stronger the correlation.
5 Levels of Quality Management
PMI defines 5 levels of increasing effectiveness:
- Level 1 (Worst): Let the customer find the defects
- Level 2: Detect and fix defects (Quality Control)
- Level 3: Inspect and improve processes (Quality Assurance)
- Level 4: Build quality into planning and design from the start
- Level 5 (Best): A quality culture embedded throughout the entire organization
PMI expects PMs to operate at levels 4–5 — building in quality from the start, not "test and fix" at the end.
Summary: Quality Management Processes
Process | Nature | Key Outputs |
Plan Quality Management | Define standards and measurement approach | Quality Management Plan, Quality Metrics |
Manage Quality (QA) | Ensure correct processes → prevent defects | Quality Reports, Test/Evaluation Documents |
Control Quality (QC) | Inspect the product → detect defects | Verified Deliverables, QC Measurements |
💡 Quick-reference cheat sheet:
- Quality = meets requirements, Grade = technical category
- Low quality = always bad, Low grade = may be OK
- QA = process, preventive / QC = product, corrective
- Accuracy = correct, Precision = consistent
- COQ: Prevention + Appraisal (conformance) vs Internal + External Failure (non-conformance)
- PDCA: Plan → Do → Check → Act
- Rule of Seven: 7 points on the same side of the mean = out of control
- Pareto 80/20: 80% of problems from 20% of causes
- Fishbone: Root cause analysis
- Verified deliverables (QC) → Accepted deliverables (Validate Scope)
Quality Management is the "least-loved" topic during PMP prep — but it yields easy points if you know the 7 tools, can distinguish QA from QC, and understand COQ. Practice identifying each tool in real-world scenarios on CertFlow — you'll find them appearing naturally across far more scenario questions than you'd expect.
Frequently Asked Questions (FAQ)
How do QA and QC differ according to PMI's definition?
QA (Quality Assurance): ensures processes and systems are working correctly — proactive, prevents defects. QC (Quality Control): ensures outputs meet standards — reactive, detects defects. QA is about the process; QC is about the product. PMI prioritizes QA because the cost of prevention is far lower than the cost of failure.
What are the components of Cost of Quality (COQ)?
COQ = Cost of Conformance + Cost of Non-conformance. Conformance: Prevention costs (training, process improvement) and Appraisal costs (testing, inspection). Non-conformance: Internal failure (rework, scrap) and External failure (warranty, recalls, reputation damage). PMI advocates investing in prevention to reduce failure costs.
What are the 7 basic quality tools?
7 Basic Quality Tools: Cause-and-Effect Diagram (Ishikawa/Fishbone), Control Chart, Flowchart, Histogram, Pareto Chart, Run Chart, and Scatter Diagram. On the PMP exam, you'll frequently encounter questions about when to use each tool — for example, use the Pareto chart to find the 20% of causes responsible for 80% of problems.
Now that you understand project quality management — it's time to put it into practice with real exam questions.
Next article: Project Risk Management: From Identify to Risk Response
Continuous improvement: Lessons Learned, OPAs & PDCA according to PMBOK 8
Try Free PMP Practice Questions →
Official References: