Your project is late not because the team worked slowly, but because you never identified the critical path. Learn CPM, PERT, and SPI essentials.
There is a saying in project management that I really like:
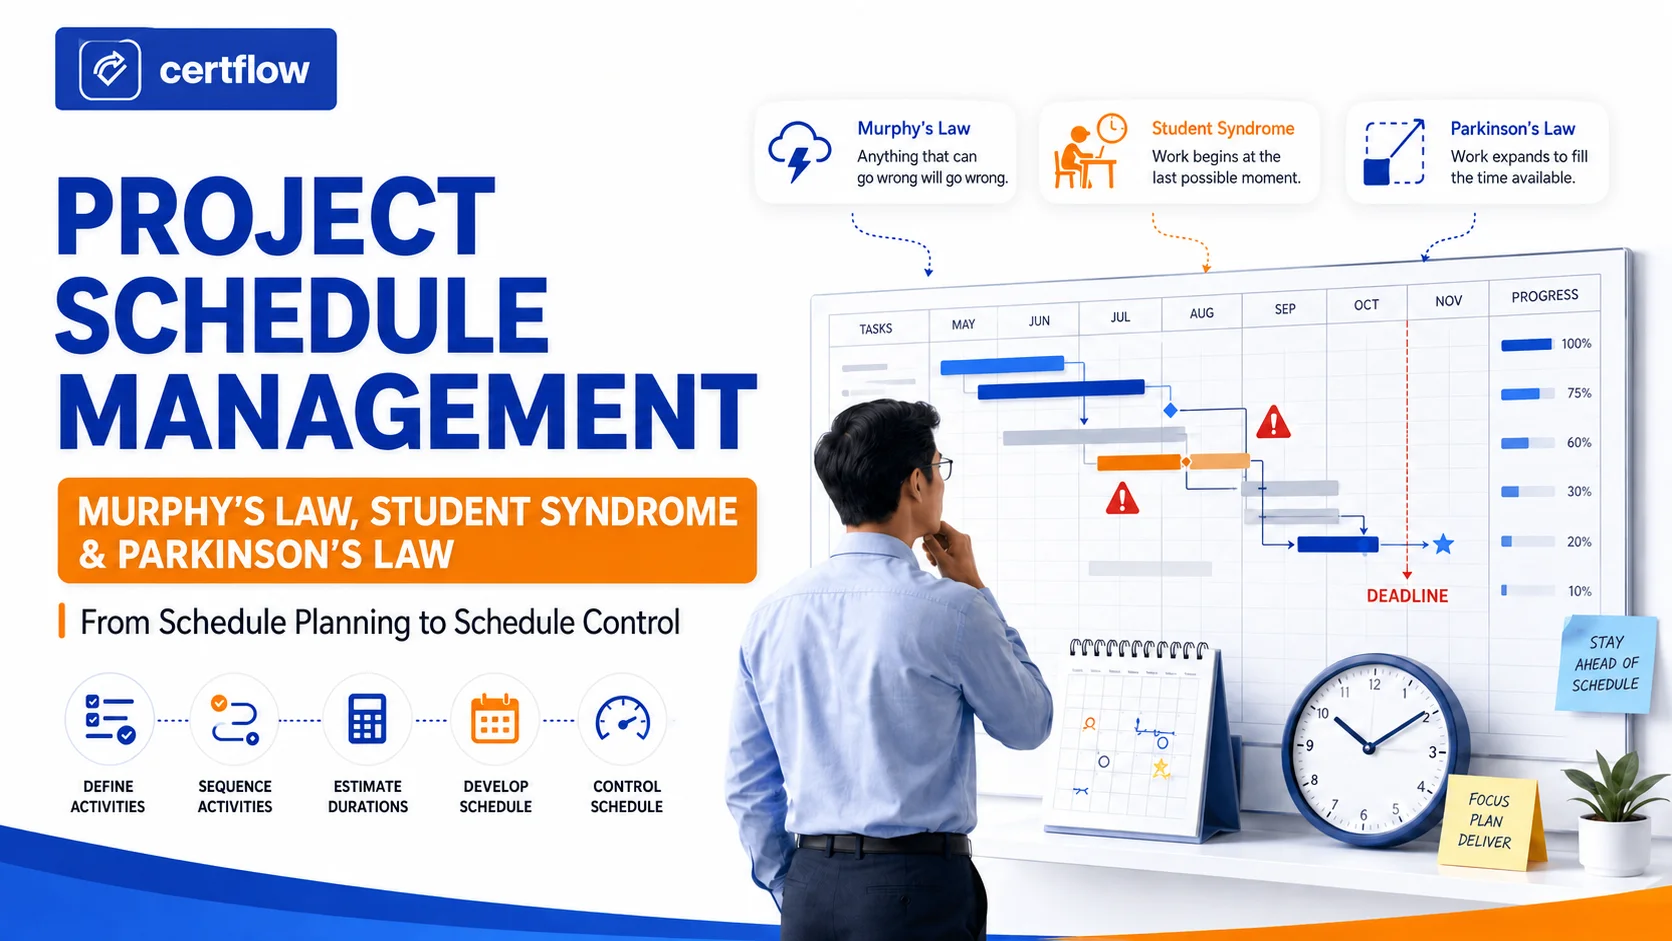
"Murphy's Law — What can go wrong, will go wrong."
And if there is one place Murphy visits most often, it is the project schedule.
But the problem is not just Murphy. There is also Student Syndrome — waiting until the last minute to start. And Parkinson's Law — work expands to fill the time allowed for it. Add in the habit of padding — team members tend to "buffer" extra time into their estimates to play it safe. Put it all together and you have a perfect formula for missing deadlines.
This article walks through the complete schedule management process — from planning and defining activities, to sequencing, duration estimating, schedule development, and schedule control. This is the most technically dense area of the PMP exam, with many specific formulas and methods to master.
Foundational Concepts
What Is a Schedule?
A schedule is a list of the project's milestones, deliverables, and activities — along with their planned start and finish dates. It is the "time map" for the entire project.
Milestone
A milestone is a significant event that marks the completion of a major deliverable or key event. The key detail: a milestone has a duration of zero — it is a point in time, not a span of time. On the PMP exam, if a question asks about the duration of a milestone, the answer is always 0.
The Three "Schedule Diseases"
- Padding: Team members add buffer time to their estimates to hedge against risk → the total timeline gets inflated.
- Student Syndrome: There is slack time available, but work does not begin until the deadline is near → all buffer is wasted.
- Parkinson's Law: Work expands to fill the time allocated → a 3-day task given 5 days will take exactly 5 days.
Plan Schedule Management
Before doing anything, you need to plan — defining the policies, procedures, and documentation that guide how the schedule will be developed, managed, and controlled.
The Schedule Management Plan is a component of the project management plan and includes:
- Tools and methods for developing the schedule model
- Release and iteration length (for Agile)
- Level of accuracy and units of measure
- Rules for performance measurement (% complete, SV, SPI)
- Control thresholds
- Reporting format
Define Activities — From Work Package to Activity
Recall from Scope Management: the WBS decomposes down to work packages. In Schedule Management, work packages are broken down further into activities — the specific actions that need to be carried out.
Work Package vs. Activity
Work Package | Activity |
The set of activities needed to produce a deliverable | The specific effort required to complete a work package |
Typically involves multiple groups of people | Should be assignable to one person or a small team |
Belongs to Scope Management (WBS) | Belongs to Schedule Management |
Rolling Wave Planning
An iterative planning technique: near-term work is planned in detail, while work further out is planned at a higher level. As distant work approaches, more detail is added.
- Work package: The lowest level of the WBS — fully decomposed, with activities underneath it.
- Planning package: The current lowest level of the WBS that has not yet been fully decomposed — it will be broken down further as more information becomes available. It has no activities underneath it yet.
Outputs
- Activity List: A list of activities with names, IDs, and brief descriptions.
- Activity Attributes: Extended detail including predecessors, successors, logical relationships, leads/lags, resource requirements, constraints, and imposed dates.
- Milestone List: A list of all project milestones.
Sequence Activities — Establishing Logical Order
Once you have the activity list, the next step is determining the order of execution. Which activities must come first? Which can run in parallel?
4 Types of Dependencies
Type | Description | Example |
Mandatory (Hard logic) | Required — inherent to the nature of the work or the contract | Foundation must be poured before walls can be built |
Discretionary (Soft logic) | Optional — based on best practice or experience | Painting walls before or after laying carpet — either order works |
Internal | Within the project's control | Design team must finish before the development team begins |
External | Outside the project's control | Waiting for a deliverable from another project or a board decision |
4 Types of Logical Relationships (PDM)
The Precedence Diagramming Method (PDM) defines four types of relationships between activities:
- Finish-to-Start (FS): B cannot start until A finishes — the most common relationship
- Finish-to-Finish (FF): B cannot finish until A finishes
- Start-to-Start (SS): B cannot start until A starts
- Start-to-Finish (SF): B cannot finish until A starts — the rarest relationship
Lead and Lag
- Lead: The amount of time a successor activity can start earlier than the predecessor finishes. Example: begin painting 2 days before installation is complete.
- Lag: A wait time that the successor must delay after the predecessor finishes. Example: after pouring concrete, you must wait 3 days for it to cure before continuing.
📍 Memory tip: Lead = starting early ("lead the way" → go ahead). Lag = waiting ("lagging behind" → falling back). Lead compresses the schedule; Lag extends it.
Estimate Activity Durations — Duration Estimating
This is the part many project managers dread the most — because inaccurate estimates are the root cause of nearly every schedule problem.
4 Estimation Techniques
Technique | How It Works | Accuracy | Time / Cost |
Analogous (Top-down) | Uses data from similar past projects | Lowest | Fastest and cheapest |
Parametric | Uses statistical relationships: quantity × unit duration | Moderate | Moderate |
Bottom-up | Decomposes into detail, estimates each component, then rolls up | Highest | Slowest and most expensive |
Three-point (PERT) | Uses three estimates: Optimistic, Most Likely, Pessimistic | Improves accuracy | Moderate |
PERT — Formulas You Must Know
When historical data is insufficient or you need to account for uncertainty:
- O = Optimistic (best case)
- M = Most Likely (realistic)
- P = Pessimistic (worst case)
Two formulas:
- Triangular Distribution: E = (O + M + P) / 3
- Beta Distribution: E = (O + 4M + P) / 6 ← more commonly used — memorize this for the exam
Reserve Analysis
Contingency Reserve is added to address identified risks. It must be clearly defined and documented. This is distinct from Management Reserve — which is set aside for unknown risks and is controlled by management.
Pro Tip: On the PMP exam, when asked "which estimation technique is the most accurate" → Bottom-up. When asked "which technique is fastest with limited information" → Analogous. When asked "which technique accounts for uncertainty" → Three-point / PERT.
Develop Schedule — Building the Schedule
Now comes the most demanding part: combining all the information above to create the project schedule.
Critical Path Method (CPM)
CPM is the most important technique in schedule management — and it will definitely appear on your PMP exam.
The critical path is the longest sequence of activities in the network diagram — it determines the shortest possible time to complete the project. Any delay on the critical path directly delays the entire project.
Float (Slack) — 3 Types
- Total Float: The total amount of time an activity can be delayed without delaying the project end date. Activities on the critical path have a total float of 0.
- Free Float: The amount of time an activity can be delayed without delaying the early start of the immediately following activity. Free float exists only when two or more activities share the same successor.
- Project Float: The amount of time the project can be delayed relative to a completion date imposed by the customer or management.
Forward Pass and Backward Pass
To calculate float, you perform two passes through the network diagram:
- Forward Pass: Calculates ES (Early Start) and EF (Early Finish) for each activity. Formula: EF = ES + Duration - 1
- Backward Pass: Calculates LS (Late Start) and LF (Late Finish). Formula: LS = LF - Duration + 1
- Total Float = LS - ES (or LF - EF)
Frequently Asked Questions About the Critical Path
- Can a project have more than one critical path? → Yes. When it does, risk increases because multiple paths can cause delays.
- Can the critical path change? → Yes. When activities are delayed or resources change, the critical path can shift.
- Can the critical path have negative float? → Yes. This means the project is behind schedule.
Schedule Compression — When You Need to Go Faster
The deadline is fixed but the critical path is longer than expected. How do you shorten it? There are two main techniques:
Crashing | Fast-tracking | |
How | Add resources to activities on the critical path | Run critical path activities in parallel instead of sequentially |
Consequence | Almost always increases cost | Increases risk and may cause rework |
Principle | Choose the option with maximum compression at minimum cost | Communication requirements increase significantly |
Exam tip: Crashing = spend more money (increases cost). Fast-tracking = take on more risk (increases risk). When asked "how to shorten the schedule without increasing cost" → Fast-tracking. When asked "how to shorten without increasing risk" → Crashing. When the question is open-ended → analyze the context to choose.
Resource Optimization — Balancing Resources
Sometimes the problem is not duration but resource conflicts — one person is assigned two tasks at the same time, or equipment is only available during certain windows.
Resource Leveling | Resource Smoothing | |
Purpose | Balance demand with supply when resources are overallocated | Adjust activities within existing float constraints |
Impact on Critical Path | Yes — typically extends the critical path | No — critical path is unchanged |
Impact on Completion Date | May delay it | Does not delay it |
When to Use | When resources are only available at certain times or are assigned to multiple tasks simultaneously | When you want to balance resources but cannot allow delays |
⚠️ Quick distinction: Resource Leveling prioritizes resources → may extend the schedule. Resource Smoothing prioritizes the schedule → only adjusts within float, no delays allowed.
Project Schedule — Final Output
The result of the entire process above is the Project Schedule — which can be displayed in several formats:
- Milestone Charts (Master schedule): Show milestones only — used for reporting to senior management
- Gantt Charts / Bar Charts: Display activities as horizontal bars along a timeline — used for progress tracking and team reporting
- Network Diagrams (PDM): Show the logical dependencies between activities
Schedule Baseline
The approved version of the project schedule — a component of the project management plan. It can only be changed through formal change control procedures. It serves as the basis for comparing actual progress against the plan.
Control Schedule — Monitoring and Adjusting
A schedule is not something you create and then forget — it requires continuous monitoring throughout the project.
- Monitor activity status — where does actual progress stand?
- Update the schedule model with actual data
- Compare actual start/finish dates against the baseline — is there any variance?
- Manage changes through Integrated Change Control — never modify the baseline unilaterally
Summary: The Schedule Management Process
Step | Process | Key Output |
1 | Plan Schedule Management | Schedule Management Plan |
2 | Define Activities | Activity List, Activity Attributes, Milestone List |
3 | Sequence Activities | Network Diagram |
4 | Estimate Activity Durations | Duration Estimates |
5 | Develop Schedule | Schedule Baseline, Project Schedule |
6 | Control Schedule | Schedule forecasts, Change requests |
Cheat sheet — key points to remember:
- Milestone duration = 0
- FS is the most common relationship; SF is the rarest
- Lead compresses the schedule; Lag extends it
- Bottom-up = most accurate; Analogous = fastest
- PERT Beta: E = (O + 4M + P) / 6
- Critical Path = longest path = shortest possible project duration
- Float = LS - ES (or LF - EF)
- Crashing = increases cost; Fast-tracking = increases risk
- Resource Leveling = may delay; Resource Smoothing = no delay
- Milestone charts for management; Gantt charts for the team
Schedule management is one of the most technically demanding areas of the PMP — but it is also the easiest to score on once you have the formulas and concepts down cold. Practice calculating the critical path, float, and PERT on CertFlow until it becomes second nature — you will save yourself a great deal of time in the exam room.
You now have a solid grasp of project schedule management — it is time to put it into practice with real exam questions.
Next article: Project Cost Management: EVM & Budget Control
Try Free PMP Practice Questions →
Official References: